Arduino Nano 33 IoT Debugging © LGPL
DESCRIPTION
There is nothing more frustrating than a project nearly working as intended, and there is only so much you can print to serial to understand your code.
This is where debugging tools come in to allow you to stop the code executing at specific points, and allow you to inspect the variables, and move through the code line by line if desired.
We can use the GDB debugging system and an external hardware debugger with the Arduino Nano 33 IoT board thanks to its breakouts with a little soldering.
With the Arduino IDE + Visual Micro + Visual Studio software set we have the full IDE experience along with these debugging tools out of the box.
The Soldering
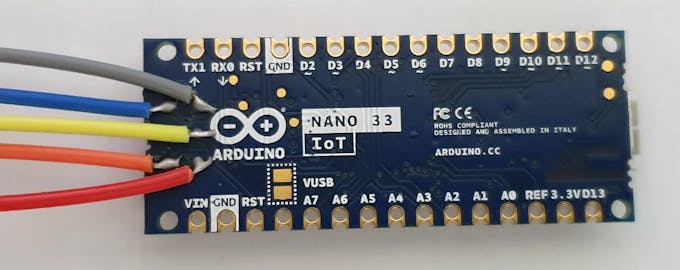
Before we can connect our Nano 33 IoT board to our external debugger, we need to connect some female jumper wires onto the pads on the back of the board as below.

An External Hardware Debugger
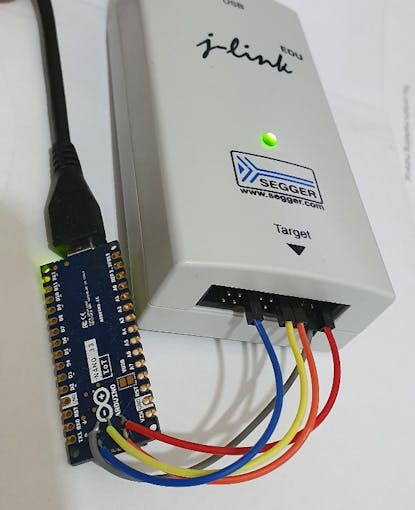
There are a variety of external hardware debugging devices available, and in this example we will be using the Segger J-Link debugger (EDU available for Educational use at a lower cost).
Other debuggers such as the Black Magic Probe are also available, and connect in the same way as shown here, and it is available in Visual Micro already. You can also make your own Probe as shown in our Nano 33 BLE article.
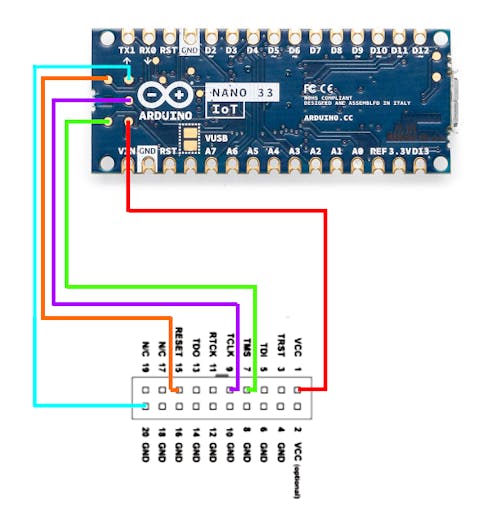
The connections between the two devices are shown below.
Driver Setup
Some debuggers need an additional USB Driver installing on Windows to allow the debugging work correctly.
In our J-Link example you will need the Zadig tool, and to install the driver so they match in the tool.
Open the Zadig tool after downloading
Select Options > List All Devices
Now drop down the device list and select your device (JLink in this case).
If two devices are present select the "Interface 0" of the device
If the driver versions do not match, click Install Driver
There is a handy list of debugger / additional driver information on this page.
Debugging Setup
Once you are setup with the Arduino IDE + Visual Studio + Visual Micro, you can start debugging straight away.
Simply open your project and select the correct board and COM port.
Now you can set the debugger to "Hardware" which will expose a new list of pre-configured debuggers.
Select the one you are using, and ensure the vMicro > Debugger > Optimisation is set to "No Project + Libraries".
Add a breakpoint in where you want to stop initially, these can be moved once you have started the debugger, and there is often a limit of 6 concurrent breakpoints.
Now simply build and upload your code, and attach the debugger. You can also do this in one step by simply pressing Debug > Start Debugging.
A video of this Debugging Setup section is below:
Solve Those Problems
You should now be stopped on your break point, and a number of other windows are available on the Debug > Windows menu, if you do not see all of the watches / autos, etc.. windows that you wish to use.
Using the stepping and inspection tools, you can now move through the code to find the issues.
Useful Links
Getting started with the Arduino NANO 33 IoT
Black Magic Wiki and Hardware Listing / Vendors
Visual Micro - Nano 33 IoT Debugging Overview
 |
| × | 1 | |||
 |
| × | 5 | |||
| × | 1 |
 |
| |||
 |
| |||
 |
|


There is nothing more frustrating than a project nearly working as intended, and there is only so much you can print to serial to understand your code.
This is where debugging tools come in to allow you to stop the code executing at specific points, and allow you to inspect the variables, and move through the code line by line if desired.
We can use the GDB debugging system and an external hardware debugger with the Arduino Nano 33 IoT board thanks to its breakouts with a little soldering.
With the Arduino IDE + Visual Micro + Visual Studio software set we have the full IDE experience along with these debugging tools out of the box.
The Soldering
Before we can connect our Nano 33 IoT board to our external debugger, we need to connect some female jumper wires onto the pads on the back of the board as below.
An External Hardware Debugger
There are a variety of external hardware debugging devices available, and in this example we will be using the Segger J-Link debugger (EDU available for Educational use at a lower cost).
Other debuggers such as the Black Magic Probe are also available, and connect in the same way as shown here, and it is available in Visual Micro already. You can also make your own Probe as shown in our Nano 33 BLE article.
The connections between the two devices are shown below.
Driver Setup
Some debuggers need an additional USB Driver installing on Windows to allow the debugging work correctly.
In our J-Link example you will need the Zadig tool, and to install the driver so they match in the tool.
Open the Zadig tool after downloading
Select Options > List All Devices
Now drop down the device list and select your device (JLink in this case).
If two devices are present select the "Interface 0" of the device
If the driver versions do not match, click Install Driver
There is a handy list of debugger / additional driver information on this page.
Debugging Setup
Once you are setup with the Arduino IDE + Visual Studio + Visual Micro, you can start debugging straight away.
Simply open your project and select the correct board and COM port.
Now you can set the debugger to "Hardware" which will expose a new list of pre-configured debuggers.
Select the one you are using, and ensure the vMicro > Debugger > Optimisation is set to "No Project + Libraries".
Add a breakpoint in where you want to stop initially, these can be moved once you have started the debugger, and there is often a limit of 6 concurrent breakpoints.
Now simply build and upload your code, and attach the debugger. You can also do this in one step by simply pressing Debug > Start Debugging.
A video of this Debugging Setup section is below:
Solve Those Problems
You should now be stopped on your break point, and a number of other windows are available on the Debug > Windows menu, if you do not see all of the watches / autos, etc.. windows that you wish to use.
Using the stepping and inspection tools, you can now move through the code to find the issues.
Useful Links
Getting started with the Arduino NANO 33 IoT
Black Magic Wiki and Hardware Listing / Vendors
Visual Micro - Nano 33 IoT Debugging Overview
The header shown is from the Segger JLINK and we are using it in SWD mode here.
