DIY FFT Audio Spectrum Analyzer © GPL3+
DESCRIPTION
FFT spectrum analyzer is a test equipment that uses Fourier analysis and digital signal processing techniques to provide spectrum analysis. Using Fourier analysis it is possible for one value in, for example, the continuous time domain to be converted into the continuous frequency domain, in which both magnitude and phase information are included.
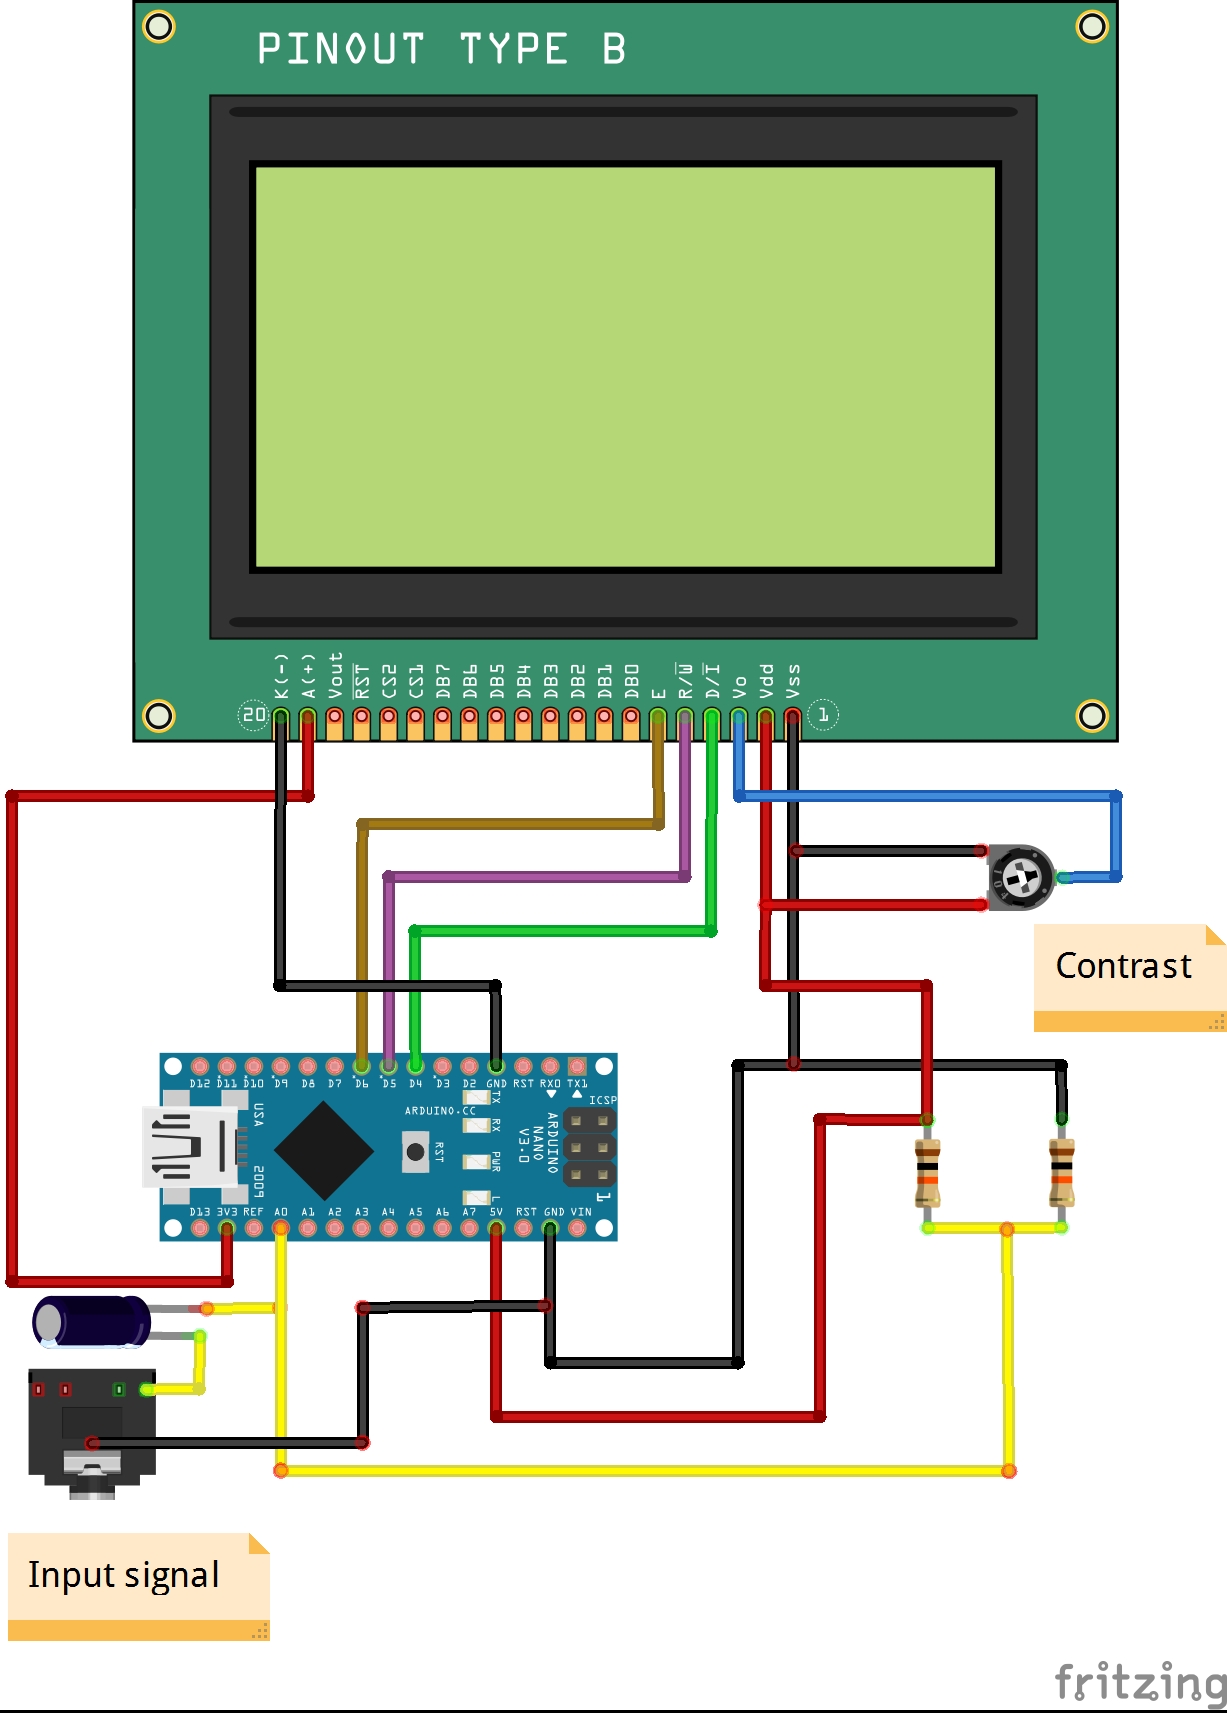
The described device is exactly such a Spectral Analyzer that is made with the help of an Arduino microcontroller. Аs you can see the device is very simple and contains only a few components :
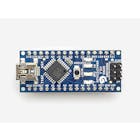
- Arduino Nano
- LCD display with a resolution of 128 by 64 pixels (ST7920 128x64 LCD)
- Two resistors (10KOhm)
- Potentiometer (10KOhm) and
- Capacitor (1 microF)
The audio input to the Arduino is on A0, with bias at the mid point by 10K to Ground and 10K to +5V. At the input we can also set a potentiometer to control the amplitude of the input signal.
Code is also simple and it uses "fix_fft" libray which was created for this purpose
The video describes several cases where different types of signals have been analyzed:
When analyzing a sinusoidal input signal, the carrier is clearly visible and By changing the frequency of the signal generator, the position of the carrier also changes.
If we bring a rectangular signal to the input, on the spectral analyzer is clearly visible the fundamental signal, as well as the three odd harmonics x3, x5 & x7.
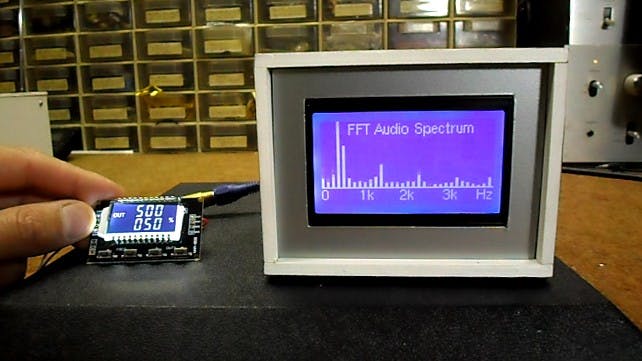
If we bring an audio music signal to the input, this device is actually a graphics audio analyzer that can be found in more expensive audio equipments

Finally, the entire assembly is housed in a suitable box. This is not a professional tool because it has low resolution and frequency range, but can serve as a great educational tool.
 |
| × | 1 | |||
| × | 1 | ||||
 |
| × | 2 | |||
 |
| × | 1 | |||
 |
| × | 1 |
 |
|

FFT spectrum analyzer is a test equipment that uses Fourier analysis and digital signal processing techniques to provide spectrum analysis. Using Fourier analysis it is possible for one value in, for example, the continuous time domain to be converted into the continuous frequency domain, in which both magnitude and phase information are included.
The described device is exactly such a Spectral Analyzer that is made with the help of an Arduino microcontroller. Аs you can see the device is very simple and contains only a few components :
- Arduino Nano
- LCD display with a resolution of 128 by 64 pixels (ST7920 128x64 LCD)
- Two resistors (10KOhm)
- Potentiometer (10KOhm) and
- Capacitor (1 microF)
The audio input to the Arduino is on A0, with bias at the mid point by 10K to Ground and 10K to +5V. At the input we can also set a potentiometer to control the amplitude of the input signal.
Code is also simple and it uses "fix_fft" libray which was created for this purpose
The video describes several cases where different types of signals have been analyzed:
When analyzing a sinusoidal input signal, the carrier is clearly visible and By changing the frequency of the signal generator, the position of the carrier also changes.
If we bring a rectangular signal to the input, on the spectral analyzer is clearly visible the fundamental signal, as well as the three odd harmonics x3, x5 & x7.
If we bring an audio music signal to the input, this device is actually a graphics audio analyzer that can be found in more expensive audio equipments
Finally, the entire assembly is housed in a suitable box. This is not a professional tool because it has low resolution and frequency range, but can serve as a great educational tool.