Test DHT22 Sensors with Arduino and MATLAB © GPL3+
DESCRIPTION
Have you bought a bundle of temperature and humidity sensors and you have to pick up one for your project? Aren't you sure of their readings? Do you need to correct the acquired data? This project may help you!
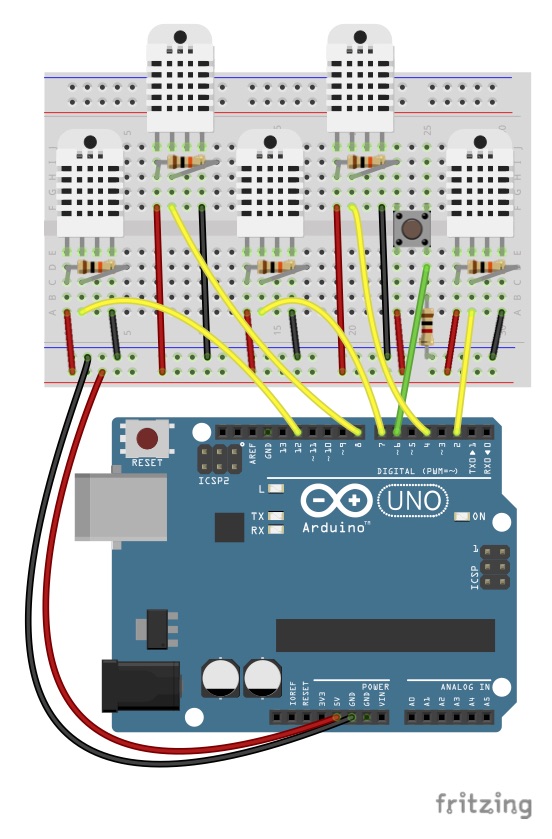
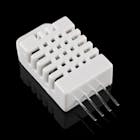
I have been inspired by a MATLAB tutorial about live plotting the temperature data acquired with Arduino. I also have a package with 5 DHT22 sensors, which I wanted to test together, to see if they read the same values and they are within the tolerance limits established by the manufacturer.


The codes here uploaded should work flawlessly, provided that you have the required MATLAB packages and you have assigned the right serial port in the MATLAB script. Please, see the comments in the code.
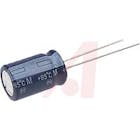
Since the MATLAB code works with a loop, you may want to disable the Arduino reset when communicating with the serial port. Add a 10uf capacitor between GND and RESET, as explained here.
The data correction, useful to align the readings of the 5 sensors, was made by checking the live values with a laboratory instrument. In my case, the sensor number 5 was the only one that correctly read both humidity and temperature in several conditions. The other sensors measured different humidity values, but the same temperature. Thus, I have used data acquired in two tests from sensor number 5 to correct the humidity readings of the other sensors. In the code here uploaded this section is commented and MATLAB will plot and export data as they are acquired from the sensors. No user action is necessary. Please see the comments in the code and, if desired, edit the correction function according to your needs.
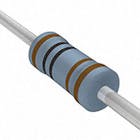
The DHT22 sensor should have a built-in resistor, but adding another 10 KOhm resistor is not a problem and should not alter the readings.
 |
| × | 1 | |||
 |
| × | 1 | |||
 |
| × | 1 | |||
 |
| × | 5 | |||
 |
| × | 1 | |||
 |
| × | 1 | |||
 |
| × | 1 | |||
 |
| × | 5 |


Have you bought a bundle of temperature and humidity sensors and you have to pick up one for your project? Aren't you sure of their readings? Do you need to correct the acquired data? This project may help you!
I have been inspired by a MATLAB tutorial about live plotting the temperature data acquired with Arduino. I also have a package with 5 DHT22 sensors, which I wanted to test together, to see if they read the same values and they are within the tolerance limits established by the manufacturer.
The codes here uploaded should work flawlessly, provided that you have the required MATLAB packages and you have assigned the right serial port in the MATLAB script. Please, see the comments in the code.
Since the MATLAB code works with a loop, you may want to disable the Arduino reset when communicating with the serial port. Add a 10uf capacitor between GND and RESET, as explained here.
The data correction, useful to align the readings of the 5 sensors, was made by checking the live values with a laboratory instrument. In my case, the sensor number 5 was the only one that correctly read both humidity and temperature in several conditions. The other sensors measured different humidity values, but the same temperature. Thus, I have used data acquired in two tests from sensor number 5 to correct the humidity readings of the other sensors. In the code here uploaded this section is commented and MATLAB will plot and export data as they are acquired from the sensors. No user action is necessary. Please see the comments in the code and, if desired, edit the correction function according to your needs.
The DHT22 sensor should have a built-in resistor, but adding another 10 KOhm resistor is not a problem and should not alter the readings.